 |
||
Navigation Topics Tutorials Others Contact |
Excel - Analysis toolsIntroduction IntroductionYou created your own decision-making model and now you want Excel to help you find the best solution for your situation. The software possesses several analysis tools that can help you. This page explains three of these tools: target value, the scenario manager and the solver. Each answers your needs in different situations. Goal SeekThis option will help you find the missing value in a cell to attain your goal. In the following example, what should be the value in the A1 cell so that the A3 cell shows 500? You already know what the result should be but not what the value in a cell should be. Instead of trying to find the answer by trial and error, Excel can find you find the answer by using the Goal Seek.
|
|
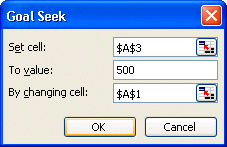
Excel needs three things to find the targeted value. Which cell has the result that you want? That cell should always have a formula.
What is the value you wish to reach for this cell?
Which cell can Excel change the value in order to get the desired result? That cell should only contain a number or a value; no formulas. Excel will refuse to proceed otherwise.
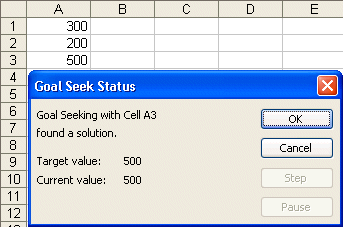
Excel will attempt to reach the goal value that you put in. It may not reach it. It depends on your model and the conditions that makes it work. For this example, Excel found the following result.
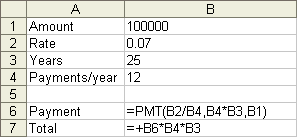
Goal seek was able to change the content of the A1 cell so that the A3 cell was able to reach the goal value of 500. The A1 cell must have a value of 300. There are also boxes where Excel will not find the results you requested. That's because there is no direct or indirect link between the goal cell and the cell you determined Excel could change. There are limits to Goal seek. Only a single cell, can be changed and the goal value must be known. It's impossible to minimize, maximize or to optimize the result in your model with this option. You'll need to look at the Solver tool to optimize your model. The data table ( 1 or 2 variables)Excel offers you several tools to analyze the results of your model. The Data table tool allows you to create a table that shows the result of certain cells if you change the contents of one or two cells. Instead of trying many "what if" situations with several values, the results will appear quickly in the form of a table. The next exercises consist in creating data tables with one or two variables with a small mortgage payment model. Before creating a data table, you must first have a complete model. For this case, the model calculates what your mortgage payments will be.
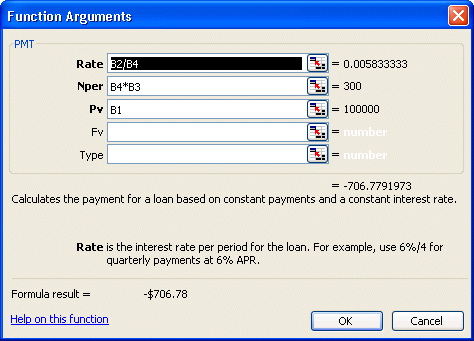
The formula in the B6 cell calculates the payments according to the interest rate, the number of payments per year and the total value to be paid. The formula in the B7 cell indicates the total sum, the capital and the interest, that you should pay before being the "true" owner of the house. It's probably a little more that you imagine.
Data table with a single variableBefore being able to use a data table, you should have a model that works correctly. Otherwise, the results of the table are worthless.
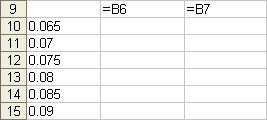
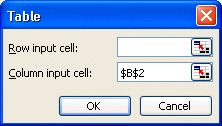
To create a data table, two data are always required. There are the cells that will show the results and the cell that contains the values that you want to change with regard to the current values. These data are always placed on the first row and the first column of the table. It's also important not to mix the values and the cells. The cells you want to see the results are placed horizontally and the values you wish to change are placed vertically. According to the data of the example you just entered, the values you want to change are on the first column and the cells you wish to see the result on are on the first row. The data table will show the effect on payments and total in the cells that are on the first row and according to the changes in the interest rate from the first column. Because you want to know what happens to your payment and the grand total when the interest rate changes. You also need to know in what cell the interest rate are stored. In this exercise, it's the B2 cell. You can now ask Excel to fill-in the data table and to replace the contents of the first row, the first column or both. Because it's about a data table with a single variable, only the following two boxes will have a cell address.
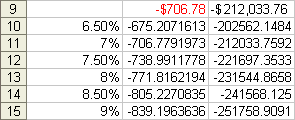
Excel calculated what would be the payment and the grand total if the interest rate changed from 6.5 % to 9 %.
The model changes immediately to show the new result. However you will have to redo the data table if you want to add other interest rates or the other cells to be compared. Data table with two variablesThe last exercise created a data table with one variable based on the interest rate. You were able to see what payment will be required when the interest rate is changed. The next exercise consists in developing a new data table with two variables. The next table will show what happens on the grand total when you increase the number of payments per year according to the interest rate.
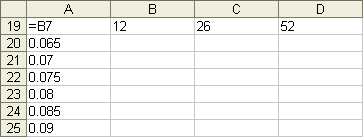
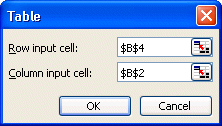
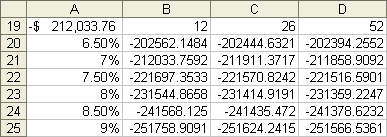
The first row represents the number of payments per year. You find this value in the B4 cell of the previous model. As for the table in a variable, the first column demonstrates the various interest rates. The value is in the B2 cell. At the intersection of the first row and the first column, you will put the address of the cell that will contain the results. For this exercise, it's the total of the payments that will be seen in the cell B6. The structure of a table with two variables allows you to look at what happens in a cell at the same moment.
As the table indicates, there is a small decline if you pay more often during the year. The capital is paid off faster and therefore you pay less interest and a smaller total value. What is more important is the change in the total as the interest rate rises. These are important sums of money that can be saved over time. Although it's very interesting to know what happens at certain cells thanks to the data tables, this technique has also some disadvantages. By using a data table with two variables, you can only see the result of a single cell at a given time. In this last box, you can always change the cell address and print or copy the results. For example, change the contents of the A19 cell to =B5. You can see what happens to payments but you lost the previous results. To resolve this problem, you must create another table. Another more important limitation is that you can only change a maximum of two variables. The scenario manager opens the other possibilities to compare situations. ScenariosWhat can you do if you want to compare several possibilities? You created a model of a company or a system. you're offered several possibilities to make it work even better. But which one is best? You can enter these various possibilities, or "scenarios", in Excel to find that answer. Once the scenarios are entered, you can view the result of important cells such as the raw profit, income, costs, ratios... In brief, any cell that you consider important. But, before you start using scenarios, you should have a working model of what you want to analyze or compare. Make sure to validate your model with several tests. Change the values of the variable cells and verify the results. Very often, you forgot something in a model; whether it's a number or a formula. It's for that reason that you must check the model completely. If the model gives bad results, the scenarios will too. One of the limitations of the scenarios is that all the variable or input cells and all the result cells must be on the same worksheet. Some of your calculations can be on other worksheets, but not the variable cells or the cells you wish to see the results. The objective of this exercise is to know the result of the A3 cell according to an optimistic or pessimistic scenario. So, two scenarios must be created that will be named "optimist" and "pessimist". Later, you can create your own scenarios to answer your needs. You 're not limited to theses names or to only two scenarios. You can have several scenarios to compare the Peter's theories to those of Paul's and Mary's. You can also merge these scenarios if you wish. To understand how scenarios work, let us take the following simple example.
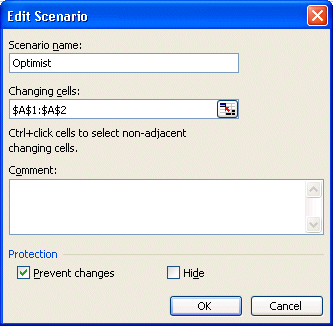
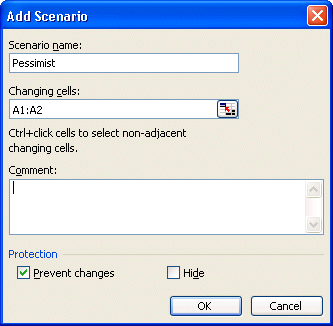
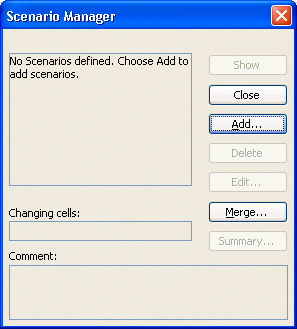
The following screen will appear. It's in this window that you will create the two scenarios named "optimist" and the other "pessimist". Don't worry if you make a mistake. You can always press the Edit button later to change the scenarios.
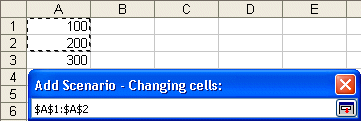
You can write the addresses or by using the left mouse button and pressing theCTRL key, click on the cells you require. The variable cells are those that you want to change the value. They will not change the values of the worksheet. These cells will be only used for the scenario.
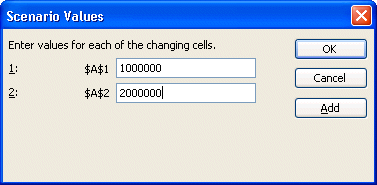
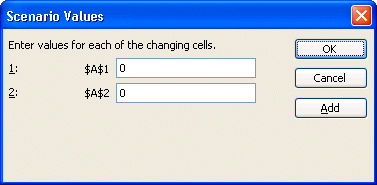
Excel will ask what are values for the cells for this scenario.
The data for the first scenario are entered. It's time to add the second scenario.
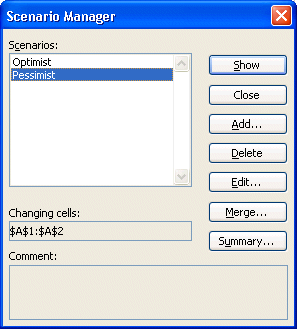
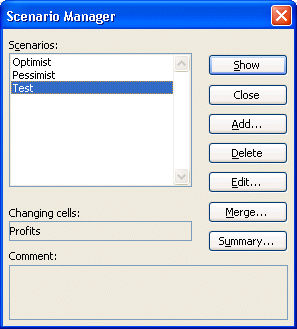
It remains only to see what will be the the result in the A3 cell. If you made an error in onr of the scenarios, now is the time to change it. Click the name of the scenario and press the button change.
Excel offers you two kinds of reports: Scenario summary and Scenario Pivot table report. The summary of scenarios generates a new worksheet with the list of the variable cells and the cells that contain the results you want to see. Once the summary as been generated, it will be impossible to change the model or the scenarios. You will have to regenerate a new summary with new results. You will then be able to compare the various analysis according to your changes. The pivot table allows you to compare the result of several variables. It also allows you to change the presentation and to carry out more detailed analyses. For more information about the pivot table, click this link.
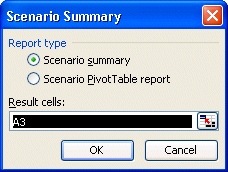
Excel will ask you in what cells the result are to be in. You can choose several cells. To select them, you can write the addresses of cells or, by keeping a finger on the keyCTRL, Click on the cells of your choice.
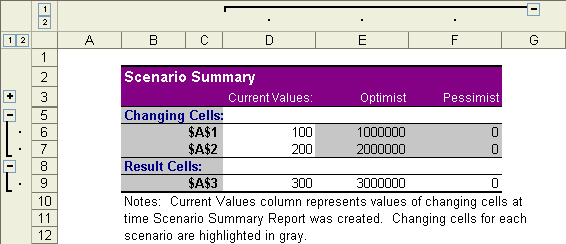
Excel will take a moment to create a new worksheet with the results of all your scenarios.
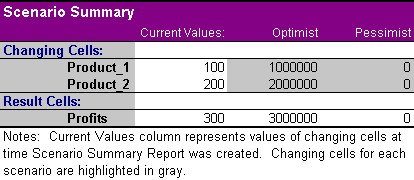
The table is in two parts. The part of the height includes the address of cells as well as its value for each of the results. The bottom part will show the results according to the scenarios. Each scenario that you have added will be presented in a different column. The grey cells at he top represent the values that you have changed in regards to the values of the worksheet. Delete the summary sheet If you want to erase the sheet to re-try.
Be careful! Make sure that the sheet you want to erase is the one that is shown on the screen. In this case, you want to erase the worksheet with the results of the scenarios and not the one that contains the model! The sheet of the file will fade. Give names to cellsThe name of the cells will appears to the left of the synthesis (A$1 , A$2 , A$3). But what represent exactly the contents of these cells? Would it not be more interesting tthat the name of the cell represent it's contant. This is another advantage to give names to the important cells.
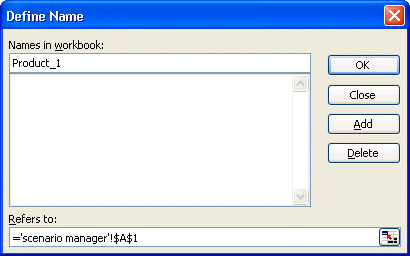
To have an underline (_), press the Shift and minus (-) keys. Excel doesn't allow spaces for a cell name. A way of by-passing this limitation is to underline between the words. Ex: August_revenus, Annual_Profit.
For this exercise, you must give a name to the A2 and A3 cells.
There is another way to give a name to a cell.
It's now time to regenerate a new analysis sheet with cell names.
It's much easier to understand the results when you have a name that represents the subject. Scenarios are very interesting when you need to compare several situations. But pay attention to three things: the Show button, the period for decimals and the replacement of a formula by a number. In the upper right corner of the window of the scenarios, the Show button allows you to show the results of a scenario on the file. It's interesting to see the effect of a scenario on the entire model. But you have to be very careful with this option. If you continue to work, it will be with the values of the scenario and not the original values. To return to the initial values:
Pay attention not to put in the Changing cell area the cells that contains a formula. Otherwise, the scenario manager will automatically replace the formula by the values in the scenario. Here is an example.
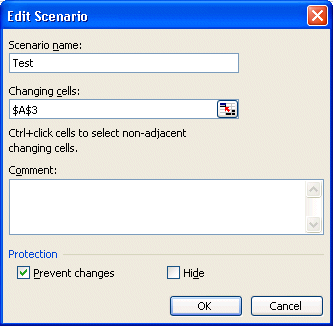
For the exercise, you must create a scenario with the variable cell that is contain in A3.
Excel will warn you that one of the cells that you have selected, the cell A3 for the exercise, contains a formula. It's warning you that it will convert the formula into a value. It will do this when showing the scenario and/or also during the analysis of the scenario. It's still possible for you to avoid the conversion by changing your scenario not to include the cell.
The value has really no importance for the example.
Excel shows you the analysis of the scenario.
Although the value is the same, there is no more formula. The administrator of scenarios replaced the formula by the value of moment. So, to avoid this situation, never select a cell containing a formula in the list of the variable cells. Excel warns you before making the conversion. There is another exercise on the scenarios on the page for creating models of this site. If you require more examples. Fusion of scenarios A limitation of the scenarios is that they are only available on the worksheet that they were created on. This is not advantageous if you want to use them somewhere else. The fusion button of scenarios allows you to copy all the scenarios of a worksheet in the other or even to another document of Excel. It can be practical when several person are working on the same model but develop different scenarios. This command allows you to group together several scenarios and compare them. In fact, one should better call them group scenarios.
For this exercise, there are already the Optimistic and pessimistic scenarios. We will suppose that there is another scenario in another document of Excel.
The box file will show the name of all the documents Excel, or file according to the term of Excel, opened at this moment. Because there are only two opened documents, Excel presumes that the popular scenarios are in the other document. You can change it to the document of your choice. The box sheet shows the name of the worksheets that exists in the file. In that box, there is only one worksheet: Evolution. At the foot of the window, it's registered to the number of scenarios included in the sheet.
The scenario that was on the Evolution worksheet was copied or "imported". If this last sheet would have had several scenarios, all would have been copied. If two scenarios would have had the same name Excel will automatically change the name of the imported scenario The solverThe solver is used for finding the optimal solution of your model according to the conditions that you determine. It can also help find how to maximize your profits, to minimize your losses or determine the best way to achieve certain numbers.
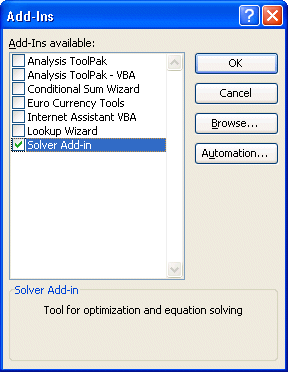
The model is very simple. It's necessary to discover what numbers are to put in cells A1 and A2 to maximize the result of the A3 cell. The first action is to activate the solver.
The option is now going to appear in the menu tools.
If the option is not shown, install it from the Office CD. The installation of Excel is not complete.
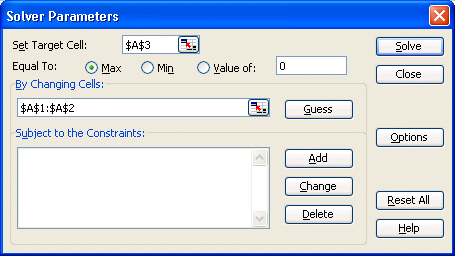
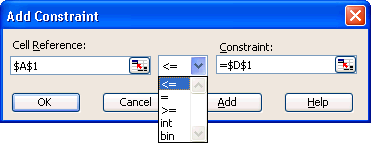
In the first box of the window, the solver asks you what's the cell to be optimize. For the example, it's the A3 cell. The solver will ask if he should minimize, maximize or optimize the value of the cell. Later, the solver will ask what are the cells that he can change in order to optimize the target cell. So that the solver works correctly, you must determine the constraints that it must respect. You can add up tol 100 constraints of your choice. For this example, you must add 4 constraints that determine the maximum and the minimum of cells A1 and A2. The minimum and maximum values that A1 cell and A2 should respect are registered in columns C and D. Why not simply enter these values directly in the constraint? It's much easier to change the contents of a cell than to try to find a constraint among a long list to change it to. It's preferable to put the values of the constraints in the cells that contain the constraint.
You have just added your first constraint. It indicates to the solver that the A1 cell should be lower or equal to the contents of the cell D1. You have just determined the maximum that the A1 cell can reach. The next constraint serves for determining the minimum that the A1 cell can reach. Both others serve for the maximum and the minimum of the cell A2.
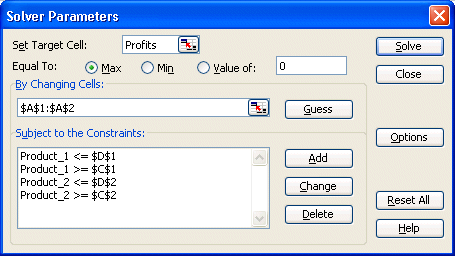
Here is the list of the constraints that you have just added.
All the data that the solver needs to resolve the problem have been entered. They are:
There is no last point to be verified.
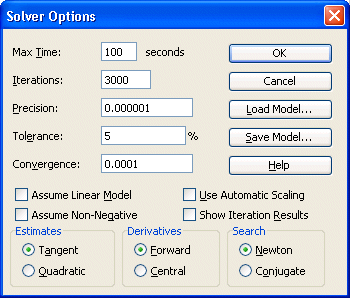
Here are some possible options of the solver.
The iterations are the trial number that the solver will carry out in order to find the optimal solution. If there are not enough iteration, the solver will not find the optimal solution. It's going to show you the best solution with the number of available iterations.
It remains only to ask the solver to find the optimal solution.
Here is the result. Excel determined that the possible maximum for the A1 cell is 1 million and that that of the cell A2 is 2 millions. So, for a total of 3 millions in the A3 cell. This was a very simple example. But you can now use the concepts that you have just seen to leave the solver to determine the optimal solution for much more complex models. Note: |

 .
.
 t
t 