Why a chart?
 To
simplify the analysis of a mass of data. To
simplify the analysis of a mass of data.
 To
analyze quickly the trends of the series of data. To
analyze quickly the trends of the series of data.
 To
be able to compare the data. To
be able to compare the data.
 To
analyze proportions. To
analyze proportions.
Creating a chart form with the assistant
 From
the main menu, select the tab Forms From
the main menu, select the tab Forms  . .
 Press the New button. Press the New button.
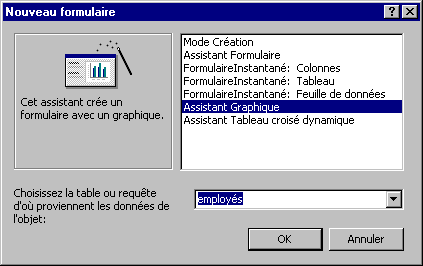
 From
the list of the available options, select the option Attending chart. From
the list of the available options, select the option Attending chart.
The "source" of a form or a report can be a table or a query. The query to
use records that answer the wanted criteria or resulting from several connected
tables. It's a point to consider during the creation of a chart.
 For
this exercise, select the Employees table. For
this exercise, select the Employees table.
 Press the OK button. Press the OK button.
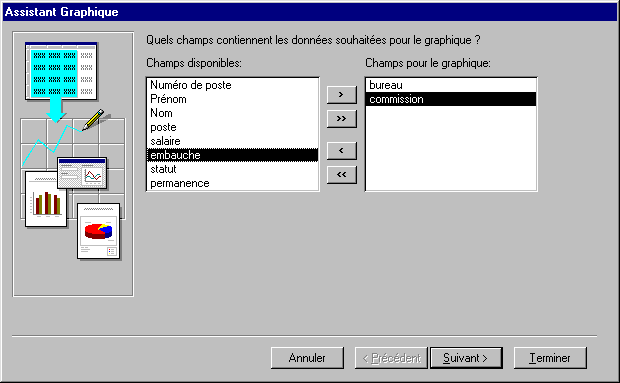
 From the list of the available fields, select fields office and Commission. From the list of the available fields, select fields office and Commission.
It's enough of:
 Choose
the field of the left column and to press the button Choose
the field of the left column and to press the button  . .
OR
 Make(do)
a double click on the wished field. Make(do)
a double click on the wished field.
 When
the wanted fields were selected, press the Next button. When
the wanted fields were selected, press the Next button.
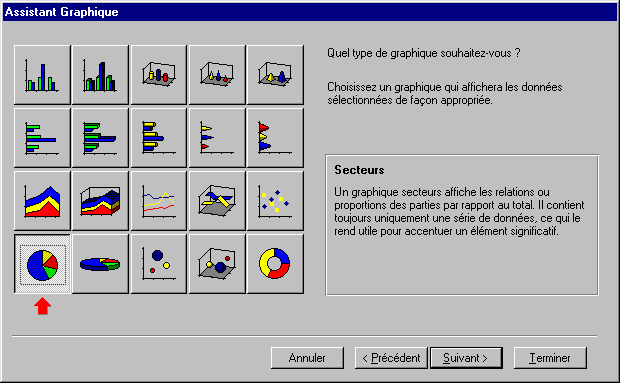
Access a list of types of chart offers you to represent your data.
 For
this exercise, select the type of chart sector. For
this exercise, select the type of chart sector.
 Press the Next button. Press the Next button.
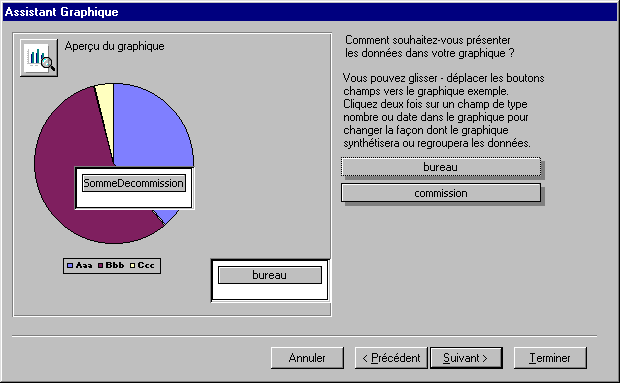
 Double-click on the button Sum Decommission. Double-click on the button Sum Decommission.
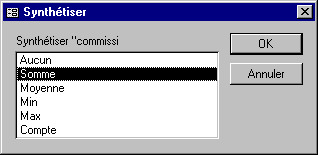
The chart form allows you to generate a synthesis on several elements of the
data. Here is a short description of each of the possible options.
None |
Show the values of the selected field. |
Sum |
Show the sum a selected field. |
Average |
Show the average of a selected field. |
Min |
Show the smallest value of a selected field. |
Max |
Show the biggest value of a selected field. |
Count |
Show the number of records of a selected field. |
 Make sure
that the synthesis is on the option Sum . Make sure
that the synthesis is on the option Sum .
 Press the OK button. Press the OK button.
It's always possible to you to change fields or synthesis by returning to
the Design view.
 For
this exercise, press the Next button. For
this exercise, press the Next button.
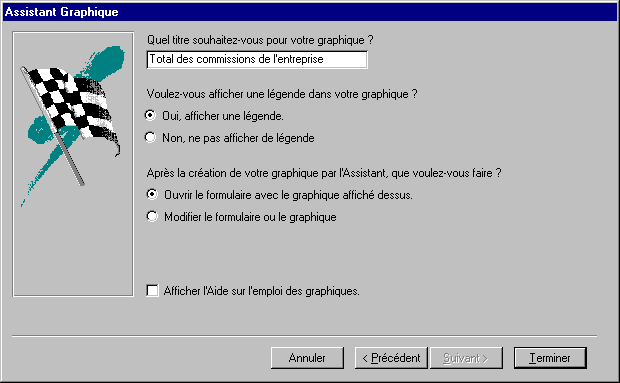
It remains still to give a name to the chart as well as to see some other possibilities.
 For
the name of the chart, enter the name: Total of the commissions
of the company. For
the name of the chart, enter the name: Total of the commissions
of the company.
 Press
the Finish button. Press
the Finish button.
Access will take a moment to generate the chart according to the
options that you chose.
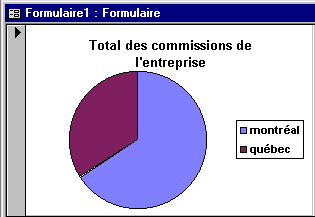
Here is the chart generated from the data of the Employees table.
Modification of the form
To be able to change the chart form, you must enter Design view.
 Press
the Press
the  button. button.
OR
 From
the Edit menu, select the Design view option. From
the Edit menu, select the Design view option.
You can change the dimension of the form to answer your needs.
To modify the presentation.
 Place
the cursor over the chart. Place
the cursor over the chart.
 Double-click on the chart. Double-click on the chart.
Access uses the generator of chart of Windows to represent the data. watch
to read the page on the insertion of a chart to
learn how to change it.
Note:
You can not modify the data from the table of data of the chart module. |
