Excel/2010:
Create a half-moon chart
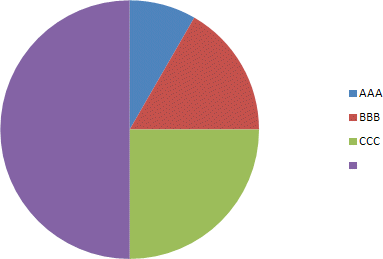
This page will show you how to make a half-moon chart. It's a variation of a Pie chart.

 Enter the values and the labels in the appropriate cells. Enter the values and the labels in the appropriate cells.
 At the end of the row, use the sum() function to have the total of all the values of the row. In this case, the D2 cell is the sum of A2 to C2 or =sum(a2:c2). At the end of the row, use the sum() function to have the total of all the values of the row. In this case, the D2 cell is the sum of A2 to C2 or =sum(a2:c2).
The last cell is very important. It must always take half of the entire total. That half will be masked later.
 Select only the cells with the values (from A2 to D2 in this case). Do not include the cells with the labels. It will only confuse Excel. Select only the cells with the values (from A2 to D2 in this case). Do not include the cells with the labels. It will only confuse Excel.
 From the Insert tab, select the first chart from the Pie category. From the Insert tab, select the first chart from the Pie category.
The chart will appear on the worksheet. In addition, the Chart Tools contextual tab will also appear every time you select a chart. The pie chart is complete. All that is left is to modify it into a half moon chart.
 Under the Design tab, select the Select Data option. Under the Design tab, select the Select Data option.
 Under the Horizontal (Category) Axis Labels, press the Edit button. Under the Horizontal (Category) Axis Labels, press the Edit button.

 Select the range of cells that include the labels for the chart. In this case, select the cells from A1 to C1. Select the range of cells that include the labels for the chart. In this case, select the cells from A1 to C1.
Do not include the A4 cell in the Axis label range. That would affect the final look of the chart.
 Press the OK button. Press the OK button.

|
