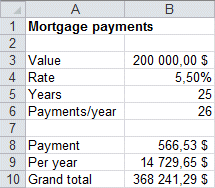
The =PMT () function used in the B8 cell will inform you of the amount you would need to pay every two weeks ( or 26 payments per year) if you took a mortgage of 200 000 $ at a rate of 5.5% for 25 years.

This model uses the PMT (Rate per period; number of payments; present value) function to determine the amount of each payment. In this analysis, the payments are due every two weeks or 26 times per year. The B9 cell will show the yearly. The B10 cell will show the grand total of all the payments. As the present values indicates, a 200 000 $ mortgage under these conditions will have to pay 368 241, 29 $ to repay the loan.
Data Table with one variable
The first example will consist in determining the amount of each payment and the yearly total if you were to change the interest rate. You could create this table by hand. But this is much faster. Also, the changes that you make to this table will immediately be recalculated.

The rates that will be calculated by the table are on the first row. The first column has the cell addresses of the results you want to see. In this case, the B8 and B9 cell addresses represent the value of each payment and the yearly total. The table with the values to compare and the cell addresses that you want to see the results in must be prepared before you can use the Data Table command.
The data from the picture above will be used to create the table. It will, fill in the blanks by using the values of the first row and place them one at the time in the B4 cell. That cell represents the rate used to determine the payments. It will then find what the values for the B8 and B9 cells are and place them in the table. Here are the instructions to create the table.

|
 Select the range of cells from A13 to G15. Select the range of cells from A13 to G15.
 Select the Data tab. Select the Data tab.
 Press the What-If Analysis button and select Data Table option. Press the What-If Analysis button and select Data Table option.
|

|
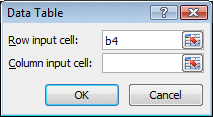
 In the Row input cell box, select the B4 cell. In the Row input cell box, select the B4 cell.
 Press the OK button. Press the OK button.
This means that the Data Table will use the values from the range's first row and place them, in the B4 cell. It will places the values from 5% to 7,5% and see what happens to the cells you want to see how they changed. In this case, those are the cells B8 and B9 as included in the first column of the range of cells. |

You can see the results generated by the Data Table. For this example, if the B4 cell is equal to 5%, the B8 cell will have a value of 539,32 $. The same rule will apply for every other cell in the table. You can now see, how easily and quickly a Data Table can be generated to help you compare many possibilities. This example only created a table when one value is changed. The next example of the Data Table will demonstrate how to create a table when you need to modify two variables.
Data Table with 2 variables
You read how to create a Data Table with one variable and tried it out. You can use the same technique to create another Data table that can change two variables. But the preparations to create this table are a little different from the previous example.
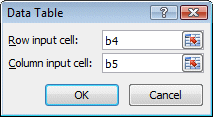
The next exercice consists to find what will be the grand total of all payments depending on the interest rate and the number of yearsthat you take to pay your mortgage (B10). For this case, you need to create a Data Table with two variables. You must place the values you want to check in the first row and the first column of the Data Table. The first row will contain the interest rate. The first column will contain the number of years you want to pay your mortgage.

 At the intersection of the first row and the first column of the table, enter the cell address you want to view the result in. For this example, enter the formula =B10. At the intersection of the first row and the first column of the table, enter the cell address you want to view the result in. For this example, enter the formula =B10.
Because of the structure of a data table with two variables, you can only see the result of a single cell. You need to create other Data tables with the same values for the first row and the first column. There is another option available but it will be explained later.
 Select the range of cells from A19 to G23. Select the range of cells from A19 to G23.
 Select the Data tab. Select the Data tab.
 Press the What-If Analysis button and select the Data Table option. Press the What-If Analysis button and select the Data Table option.

The result of the table above shows you, that the faster you pay down your mortgage, the less interest you have to pay. Your grand total will be less.
As mentioned before, this type of Data Table can only show the result of one cell at the time. But you can change the cell address to view other results.
 Change the content of the A19 cell from =B10 to =B8. Change the content of the A19 cell from =B10 to =B8.

The Data Table will recalculate itself in an instant. You can now see your payments in the time frame you chose with the best rate you can have. Paying faster also means bigger payments... |


